
COLLEGE OF FOOD, AGRICULTURAL, |
The Ohio State Phenology Calendar
|
|
COLLEGE OF FOOD, AGRICULTURAL, |
The Ohio State Phenology Calendar
|
Growing Degree Days are a measurement of the growth and development of plants and insects during the growing season. Development does not occur at this time unless the temperature is above a minimum threshold value (base temperature). The base temperature varies for different organisms. It is determined through research and experimentation. The actual temperature experienced by an organism is influenced by several factors. These factors affect growth and development. For instance, depending on the weather, an organism's temperature may be a few degrees more or less than that recorded. An organism may spend its time in the shade or under direct sunlight. The fertility and nutrient content of the soil directly affect the growth rate of insects and plants. The presence of weeds and precipitation may indirectly influence development. Due to these factors and some other scientific considerations, a base temperature of 50 degrees Fahrenheit is considered acceptable for all plants and insects.
a) Simple Method:
This method compares the daily mean temperature (Tmean) to the base (Tbase) or threshold temperature. The daily mean temperature is the average of the daily
maximum and minimum temperatures. If this average is greater than the threshold temperature, the GDD accumulated for that day is the threshold temperature
subtracted from the daily mean temperature. If the daily mean temperature is less than the base temperature, then the GDD for that day is zero. Adding the
GDD of all the days previously considered and the GDD of that day calculated the GDD of a particular day.
b) Modified Growing Degree Days:
This method sets an upper and lower threshold for temperature. Typically, 86F and 50F are used. If the daily maximum temperature is greater than 86F, then it is
reset to 86F. If the daily minimum temperature is less than 50F, then it is reset to 50F. These modified temperature are averaged and compared to the base
temperature in a similar manner to the simple method. This method is used to mainly to monitor the development of corn, the assumption being that development
does not take place beyond 86F.
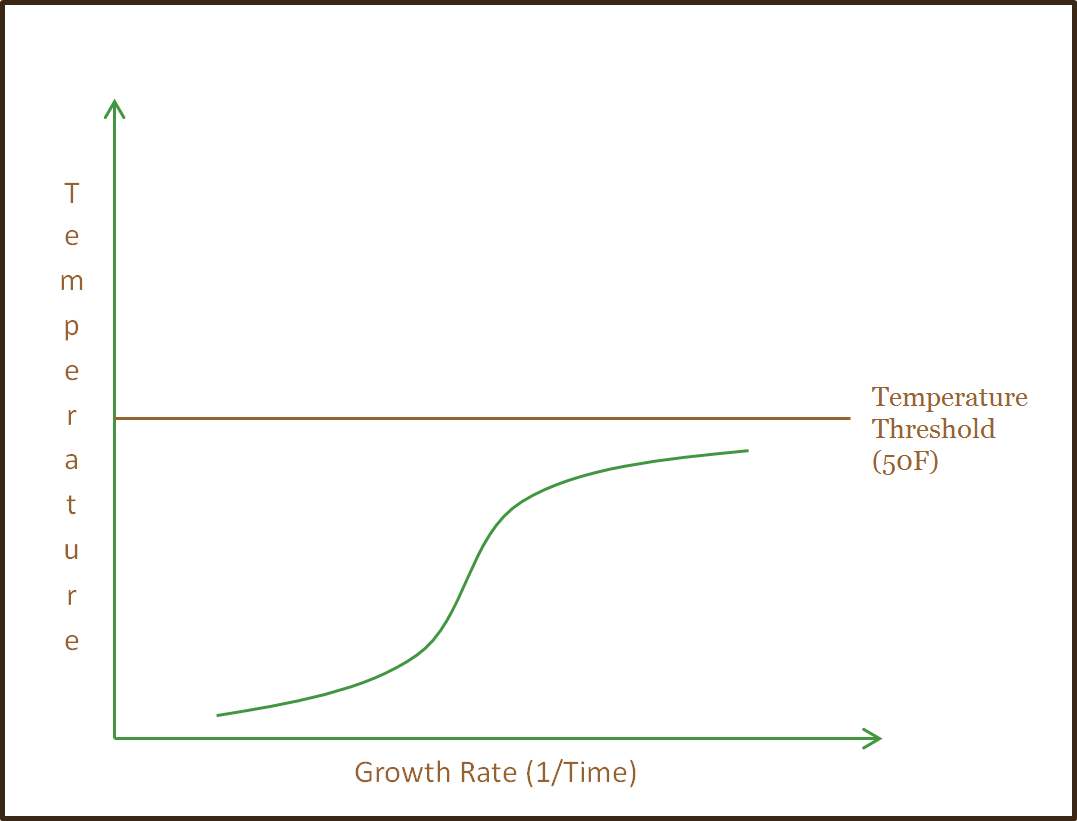
c) Sine Wave Method:
This method is considered the most accurate way to calculate the GDD. First, a graph is made. The rate of development is plotted on the x-axis (1/time) and the
temperature is located on the y-axis. The curve produced by this graph resembles a sine wave. The base temperature is considered to be 50F. From here, there are
three possible scenarios.
First, if the highest temperature of the day is below 50F (in other words, if it is under 50F for the entire day), there will simply be nothing added that day to
the cumulative GDD.
Example:
Low:30 High:40 Avg:35 Added:0
Second, if the lowest temperature of the day is above 50F (in other words, if it is above 50F for the entire day), the number added to the cumulative GDD for that
day is equal to the average temperature of the day minus the base temperature.
Example:
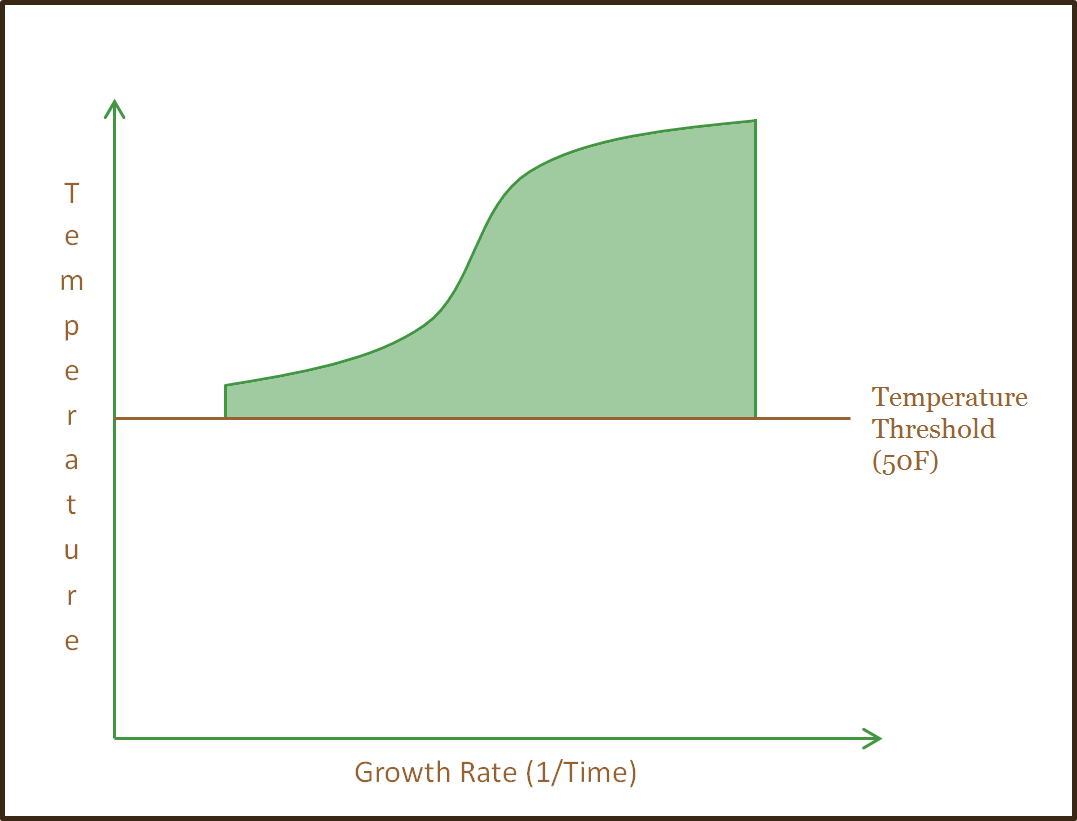
Low:60 High:70 Avg:65 Added:15
Lastly, if the low is below 50F and the high is above 50F (in other words, if it is above 50F for part of the day), a complex formula, explained below, is used to
calculate how much should be added to the GDD for that day.
Example:
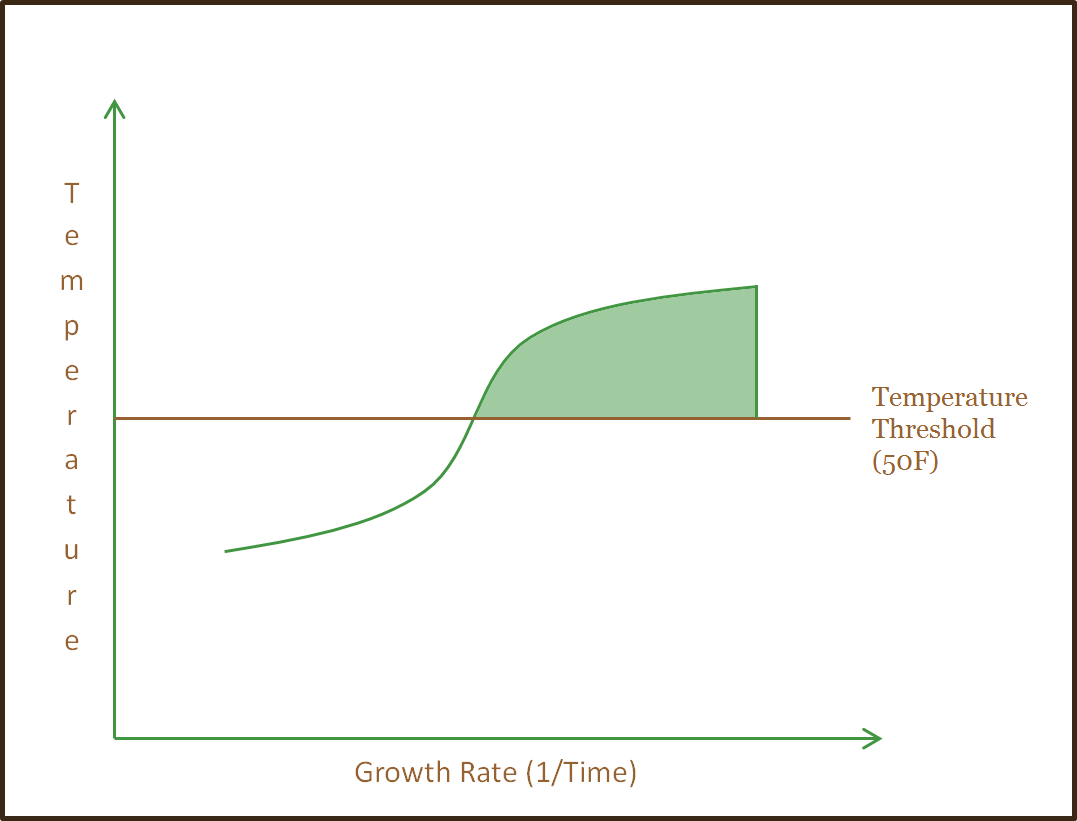
Low:40 High:80 Avg:60 Added:12.18
DayAvg = (DayHigh + DayLow)/2
κ = 50 (the base temp.)
α = (DayHigh - DayLow)/2
θ = ((κ - DayAvg)/α)
If DayHigh < κ
(New Total GDD) = (Yesterday's Total GDD) + 0
Else If DayLow > κ
(New Total GDD) = (Yesterday's Total GDD) + (DayAvg - κ)
Else
(New Total GDD) = (Yesterday's Total GDD) + (1/π) * ( (DayAvg - κ) * ( ( π/2 ) - arcsine( θ ) ) + ( α * Cos( arcsine( θ ) ) ) )

|
|
|